By Emma Thai
Introduction
At its conception, Instagram had one simple functionality in the social media space: the ability to post a single photo at a time. This meant that a user could post as many single photos as they wanted to appear on their feed, but they had to be posted separately. That functionality changed as users desired more content and the ability to post more content. Today, the platform allows up to 10 photos in a single post, with unlimited photo sharing abilities through story functions. As the limit for photos became much larger, accounts took advantage of those new capabilities, and many users post multiple images at a higher rate than single.
The Gennies’ Daily Instagram account has followed the new conventions of posting multiple photos at a time. However, single image post functionality still exists, and users still respond to and interact with single posts. An analysis was conducted on The Gennies’ Daily Instagram account to determine if single or multiple posts generated better audience engagement from 2020 and 2022.
Research questions and hypothesis
Research Question: For posting on Instagram grid and Instagram stories, are multiple images or only a single post more successful?
Hypothesis: Multiple story posts will be more successful than single, but there will be no difference between carousel and image posts.
Method
To answer this question, data was collected from Instagram Creator studio. Instagram stories data was inputted by hand, with “multiple” stories meaning multiple story posts that related to the same overall topic. Story posts would be labeled “single” or “multiple” depending on this distinction. Since stories have video length limitations, many of these posts would be videos that were separated into multiple, smaller clips. Other multiple stories included stories where the information didn’t fit on one slide or response stickers that only allowed for one response per story. The Instagram story data from 2020 had no information on single/multiple, and it was difficult to identify which stories went together from the posts alone. So, the Instagram story data is limited to just 2022.
Instagram grid data was able to be downloaded from Creator Studio into an Excel sheet. Unlike Instagram stories, Instagram labels each post as “IG Image,” a single image post, or “IG Carousel,” a post with multiple photos that a user can scroll through. In 2020, Instagram had not released its Reels feature yet, so video posts were still a popular feature. Any video posts were omitted from the data set for this study.
“Success” in the context of this report, refers to average to the following factors for each post format. Likes and reach show the number of people who interacted with or viewed the content, and impressions show the total number of times that the content was seen to determine if there is a difference in terms of the algorithm. Exits show the number of people who exited stories after viewing an individual post, which represents a deliberate action to stop seeing the content. Exits would be considered a negative factor in measuring success. Although shares and replies were considered as methods of measuring success, so few posts were shared, it would only account for a few outliers.
| Format | Success Metrics |
| Instagram Post (Carousel vs. Image) | Likes, Reach, Impressions, Engagement Rates |
| Instagram Story | Impressions, Exits, Exit Rates |
Engagement rates were calculated by dividing likes, comments, and shares by impressions, and exit rates were calculated by dividing total exits by impressions. Engagement rates for 2020 did not include shares because Instagram did not provide that information.
Sample
The sample size for each of the data sets varied greatly because of the differences in nature for each posting format. Stories tend to include far more regular content since it only stays up for 24 hours. Grid posts are much less frequent and tend to take up less of the overall posting percentage. For traditional Instagram grid posts, carousel posts are more frequent than single posts.
| Winter and Fall 2020 | Winter 2022 | Total | |
| Carousel Post | 47 | 19 | 66 |
| Image Post | 43 | 6 | 49 |
| Single Story | 0 | 125 | 125 |
| Multiple Story | 0 | 91 | 91 |
| Excluded Videos | 13 | 0 | 13 |
Results
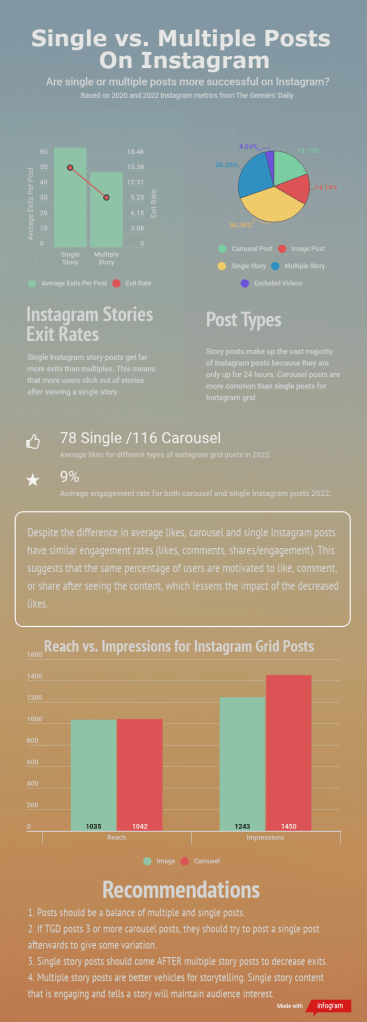
Carousel and single posts had almost identical reach with 1042 and 1035 respectively. In 2022, single-image posts had a higher average reach than carousel posts (1152 vs. 1061). However, carousels gained significantly more likes than single posts on average. Carousels received an average of 128 likes vs 90 for single posts. In both 2020 and 2022, carousel posts maintained about 30% more likes than any given single post. Although carousel posts had more likes, their respective engagement rates were less than 1% different.
Multiple story posts gained more impressions. However, the difference was less noticeable with a 10% difference from single posts. Multiple posts received 460 impressions on average vs. 417 for multiple.
The primary separating factor between single and multiple posts is in exits after the post. Single posts had almost 25% more exits than multiple posts, with an exit rate of 16%, vs 10% for multiple posts.
Analysis
The data seems to support the initial hypothesis that multiple Instagram story posts will be more successful than single posts. However, it suggested that carousel posts are more successful than single posts when looking solely at likes and impressions.
For stories, multiple posts tended to receive more impressions. Impressions only mean that there are more total views of the post. More importantly, the difference in exits is reflective of a significant separation in usage between the two. Exit rates are valuable because they show a user’s intentional choice to finish watching content on stories. There are many reasons for someone to click out of stories that aren’t all inherently tied to the content they are viewing (for example, deciding to close the Instagram app entirely), but it should still be as low as possible if the content is engaging. Multiple posts tend to keep a users’ attention longer because the content is more connected and potentially more interesting.
The “Daily Rundown” and “Headlines” posts that were posted each morning are considered single posts. This could also explain the greater exit rate. Those posts are the same every single day, so some students may click on them and see the news or events they need to know for the day and click off. “Daily Rundown” posts average about 68 exits per post, and “Headlines” posts average about 67 exits per post, both of which are slightly higher than the overall average for single stories (65 per post).
Multiple posts tend to allow for an actual story to be told, rather than just one point of news. Multiple stories can take the form of video interviews, student reactions to questions, and food reviews. One-off posts are a single picture of the colonnade or a graphic promoting a campus event.
For Instagram grid posts when there are multiple images in a post, there is a higher chance of getting more likes because carousel posts receive more likes, comments, and impressions on average. There is only a slight difference in engagement rates (less than 1% for each year, respectively) for these two types of posts. This means that the percentage of impressions that lead to actions is about the same. Based on the data, a carousel post will garner more likes overall, but not necessarily more likes per impression. This could suggest that the Instagram algorithm prioritizes carousel posts over single posts, and followers don’t prefer one format over the other.
This data shows that single Instagram posts aren’t inherently invaluable because they get fewer likes. Carousel posts should continue to be more of a priority. But for The Gennies’ Daily’s primary goals, namely campus engagement and showing the community content they would enjoy, there is minimal evidence to show that single posts aren’t as well enjoyed as carousel posts. And they have a similar reach, suggesting that they are just as likely to be shown to unique users as carousel posts.
Recommendations
Based on the analysis and research above, The Gennies’ Daily should pursue a balance between single and multiple posts to take full advantage of their engagement potential. Although carousel and multiple story posts tend to garner more attention and engagement from the audience, single posts still have a similar rate of engagement. If TGD posts 3 or more carousel posts, they should try to post a single post afterward to give some variation. Sometimes single posts are more practical, especially for certain essential news, and there’s no major difference in reach, so it is unnecessary to make a valuable post a carousel just to get more attention.
Similarly, the dynamic between multiple and single-story posts can be used to TGD’s advantage. Followers are less likely to exit a post after a multiple story post, so if TGD can post a single post after multiple posts rather than vice versa, they might be able to maintain a follower’s attention for longer without exiting stories afterward. TGD should also try to make single posts more engaging, with storytelling elements, even if they aren’t as long as multiple posts. Single graphics to promote events or give necessary information are important. However, the regularly scheduled single posts such as “Headlines” and “Daily Rundown” could be more engaging with student opinions on headlines or images that change each time.
###
This analytics report was conducted during my Winter 2022 social media class. We had to analyze one aspect of The Gennies Daily’s social media accounts. I looked into the differences in engagement and success in multiple vs. single Instagram posts from 2020-2022. I used Instagram Creator Studio and Microsoft Excel for all of the data analysis. I used Infogram to make my final one-page infographic.
